|
Example 2: In which of these
plots is the green line the
steepest, and the spread of the green points
relatively small?
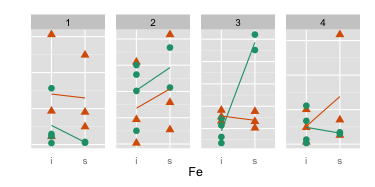
Your choice: :
Plot 3 (the third one)
Reasoning:
Green line has steep positive slope, points
close together
How certain are you on a scale of 1 to 5
(1= most
certain, 5= least certain): 1
Your Nick Name: Jane
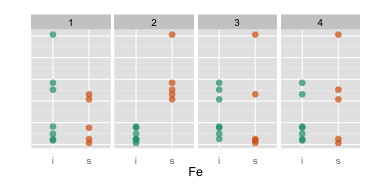
Example
3: In
which of these plots do the two groups have
the most vertical difference?
Your choice: :
Plot 4 and 3 (order matters)
Reasoning:
Points most spread, except for one point in plot 3
How certain are you on a scale of 1 to 5
(1= most
certain, 5= least certain): 1
Your Nick Name: Jane
|